Features
Business
Management
Measure for success
Metrics to track for assessing performance
June 21, 2021 By Bob Dale and Howard Conway
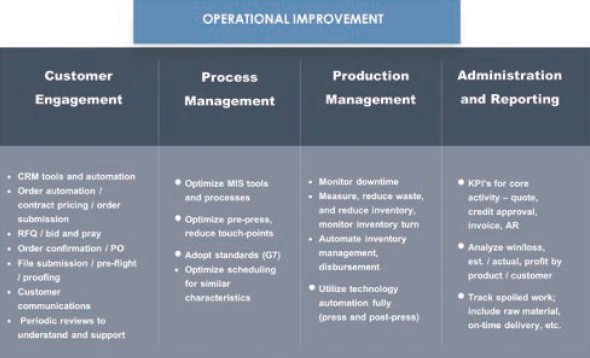 A list of key productivity indicators to track. Image courtesy Bob Dale
 Workflow improvement is a major theme in many industry publications and webinars, and for good reasons. More than 85 per cent of respondents to a recent industry survey indicated they are dealing with mostly manual processes. If that is the case with you, managing CRM, sales activity, customer inquiries, file preparation and proofing, production and related administrative activity is taking too long and is more expensive than it should be.
The goal is to improve. However, managers need to know what to improve to do so. Also, how do you check if things have improved? Measurements must therefore be established and constantly monitored.
The adage, “what gets measured gets done” is true. I’m sure many of you have a smart watch or an activity tracker. A Fitbit lets you set hourly, daily and weekly goals, motivates you to keep moving and informs you when you reach the goals! The same applies for managing your business.
The challenge is to know what to measure. Key productivity indicators (KPIs) can help with that. Since there are many types of activities and performances to measure, it is critical to select the correct metrics to avoid ‘analysis paralysis.’ Keep the following guidelines in mind when you are selecting KPIs:
• practical – simple, easy-to-get data to report, analyze, maintain, and act upon;
• fewer KPIs is likely better so you remain focused;
• identify KPIs that have the greatest impact on your business;
• automate KPI collection and reporting for greatest impact;
• draw from your MIS/ERP system for consistent, relevant information;
• in order to get information from your systems, you need to collect them;
• ensure team understands why you are collecting the data, and how you use it;
• share appropriate data with team members to align everyone’s efforts; and
• interpret what the data means (i.e. what is the root cause of the negative or positive variance and what action needs to be taken).
Measure improvement, not just activity. To do this, you need to track KPIs over a period of time to understand the changes and identify if they are positive or negative. For example, sales per month, compared to the same month in a previous year. Also remember that while revenue is a metric it can be misleading. For example, some printers are achieving increased margins with lower sales, so total revenue is only one side of the story.
How to get started
The image at the beginning of the article has some suggestions that may help. Remember, PrintingUnited publishes performance ratios that can help benchmark your financial and operational performance to industry standards.
Bob Dale and Howard Conway are with Connecting for Results Inc. They can be reached at info@connectingforresults.com.
This article originally appeared in the May 2021 issue of PrintAction.
Print this page